Anatomy of a Hole
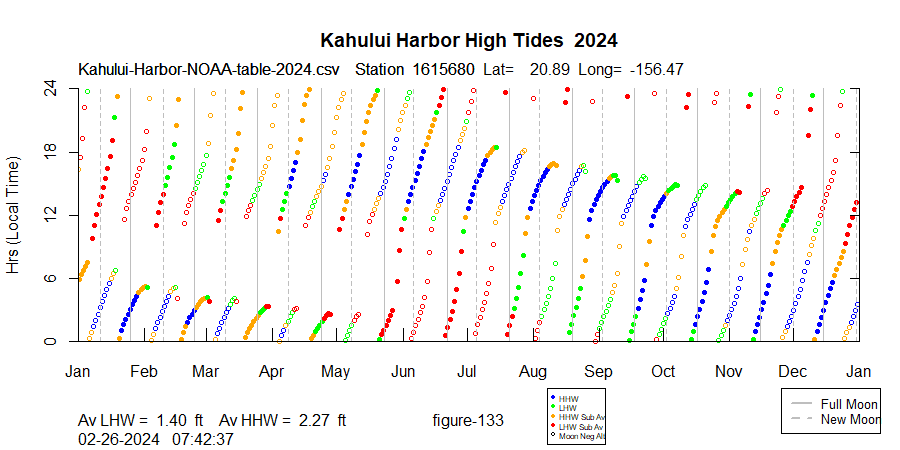
For reference here is the yearly plot of Maui's high tides:
Let's take a close look at the run of high tides that begins on March 1, circled above. The solid orange dots signify below average High High Waters related to upper transits of the Moon. This run begins a few days before full moon and terminates a few days after. At the end of the run, we see a green dot followed by a red dot, and then a gap. The green dot indicates that this high tide has lost its status as HHW -- now it is a low high water, or LHW. The tide gets weaker, shows a red dot, then disappears. What is going on?
Let's zoom in and look at these dates up close:
Around the full Moon on March 7, the tides are semi-diurnal, two mostly unequal high tides per day. The upper transit high tide occurring in the morning starts to weaken, and on March 13 shows a red dot as a LHW below the yearly average for all LHW. Now the high tides become diurnal, once per day, and the single high tide is related to a lower transit (the Moon passing through zenith on the far side of the world) of the Moon which is running through the afternoon local time in Maui. These lower transit tides are denoted by the orange hollow dots which become blue at about midnight on March 17. On the same day the upper transit high tide becomes visible again, showing as a red dot mid-day on the 17th. So the "hole" can be explained as the temporary shift from semi-diurnal to diurnal.
The upper transit high tide shows at 4am on the 13th, disappears, and then reappears at 11:30am local time on the 17th.
This plot shows the dots again, this time integrated with meridian crossing times and lunar declination. We see that the solid dots, upper transit high tides, track pretty close to the actual transit (meridian crossing) times around March 13. When the solid dots reappear on March 17, the high tide time is substantially further behind the meridian crossing than it was on March 13. We say the tidal "lag" has increased. We also see that the disappearance of the upper transit high tides has roughly coincided with a minimum in lunar declination. Lunar declination is a measurement of the Moon's apparent distance from the celestial equator, and in the northern hemisphere is correlated with the moon appearing lower in the sky. On March 17 the moon bottoms out at 35 degrees above the horizon during its upper transit.
Here is a different look at the same days:
This plot shows the dots again, this time integrated with meridian crossing times and lunar declination. We see that the solid dots, upper transit high tides, track pretty close to the actual transit (meridian crossing) times around March 13. When the solid dots reappear on March 17, the high tide time is substantially further behind the meridian crossing than it was on March 13. We say the tidal "lag" has increased. We also see that the disappearance of the upper transit high tides has roughly coincided with a minimum in lunar declination. Lunar declination is a measurement of the Moon's apparent distance from the celestial equator, and in the northern hemisphere is correlated with the moon appearing lower in the sky. On March 17 the moon bottoms out at 35 degrees above the horizon during its upper transit.
Summary
To summarize, the "holes" are caused by the temporary disappearance of *one* of the two daily high tides, coupled with an increase in lag when the missing tide reappears a few days later. The high tides have temporarily shifted from semi-diurnal to diurnal.


Comments
Post a Comment