Posts

Maui Tide Patterns Table of Contents

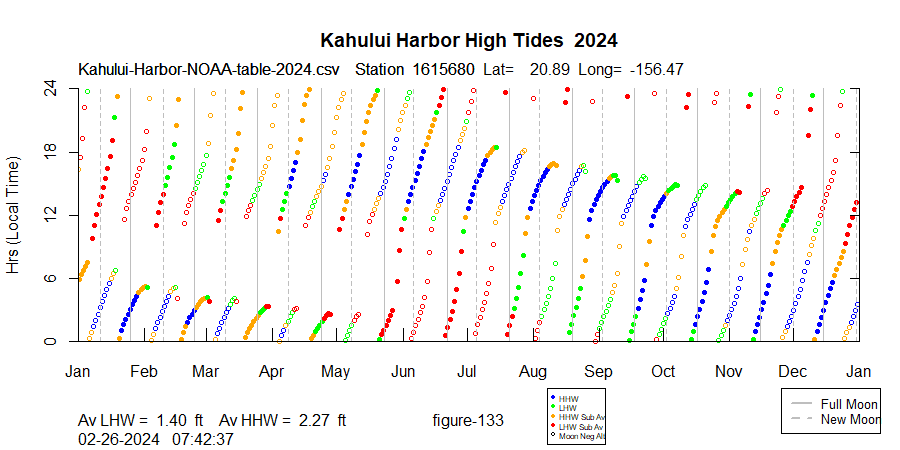
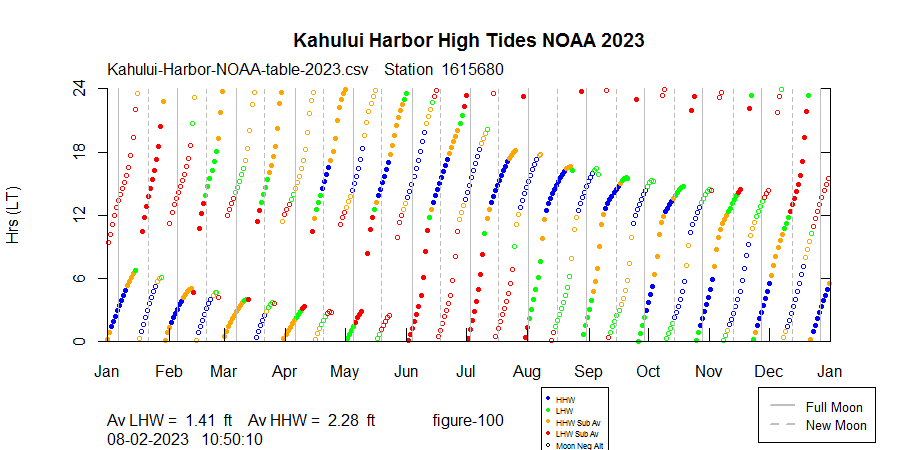
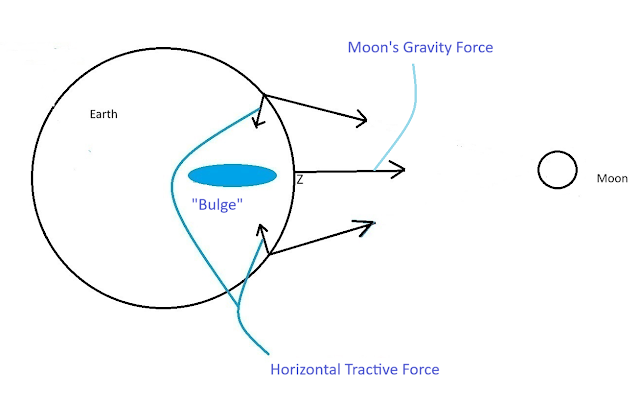
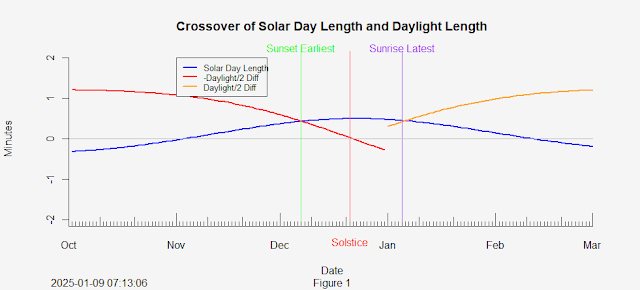
Why are Maui's high tides so weak during winter days?  When are the highest tides?  Are new moon high tides stronger than full moon tides?  Is the Moon always overhead at high tide?  Does the Moon really lift up the ocean to create the tidal bulge?  How are the tides predicted?  If you've always been curious about the tides, you've come to the right place: Maui's Weak High Tides in Winter Anatomy of a Hole Harmonic Tide Analysis King Tides, New Moons vs Full Moons Does the Moon Lift the Ocean to Create the Tidal Bulge? Tide Lagging and Priming Halifax, Long Island, San Francisco References, Acknowledgements, Contact Info

Maui's Weak High Tides in Winter

Image
 Here is a plot of NOAA high tide predictions for Kahului Harbor, Maui, in 2023: Watersport folks know that the shallow reefs in Kanaha Beach Park become problematic during winter, and this plot shows clearly how different winter is from summer in Maui in the mid-day. Terminology: " Diurnal" means a once daily tide.  Semi-diurnal means twice per day.   One might think that a word that begins "di-" would mean twice per day, since the Greek root prefix "di-" implies twice.  However, the etymology for diurnal is Latin, from dies (day), diurnus (daily). Many US ports have mainly semi-diurnal tides.  That means there will usually be two unequal high tides and two low tides.  The highest high tide is known as the "high high water (HHW)", and the lower high tide is the "low high water (LHW)".  Maui has been classified as "mixed, mainly semi-diurnal."  In 2024 Maui will have 286 days with two high tides.  On semi-diurnal days, there i

Anatomy of a Hole

Image
 For reference here is the yearly plot of Maui's high tides: Let's take a close look at the run of high tides that begins on March 1, circled above.  The solid orange dots signify below average High High Waters related to upper transits of the Moon.  This run begins a few days before full moon and terminates a few days after.  At the end of the run, we see a green dot followed by a red dot, and then a gap.  The green dot indicates that this high tide has lost its status as HHW -- now it is a low high water, or LHW.  The tide gets weaker, shows a red dot, then disappears.  What is going on?   Let's zoom in and look at these dates up close: Around the full Moon on March 7, the tides are semi-diurnal, two mostly unequal high tides per day.  The upper transit high tide occurring in the morning starts to weaken, and on March 13 shows a red dot as a LHW below the yearly average for all LHW.  Now the high tides become diurnal, once per day, and the single high tide is related to a

Harmonic Tide Analysis

Image
 We now have a good understanding, observationally, of what's going on with Maui's  high tide "holes". The holes appear when the tide shifts temporarily from semi-diurnal to diurnal. The morning high tide disappears and then reappears a few days later several hours later in the day, creating a hole in the time plot.   What is the underlying cause?  It seems clear that Maui's high tides are reacting in some way to the changing configuration of the Earth-Moon-Sun system.  Looking at the runs of high tides leading up to the "holes", one can almost feel the presence of a force that diverts and suppresses morning high tides in the first half of the year.  Is there a way to look under the hood?  How Tides are Predicted Most of you have probably seen diagrams of the forces produced by different Earth-Moon-Sun alignments, complete with tidal bulges and force vectors.  Great minds, beginning with Newton, have worked on mathematical descriptions of the forces that

King Tides, New Moons vs Full Moons

Image
 Here is a plot of every predicted high tide at Kahului Harbor in 2023: Intuitively, one might imagine that  "new moon tides are more powerful than full moons due to the moon and the sun pulling together from the same side of the Earth."  We will deal with the theory in the next blog post, "Does the Moon Really Lift the Ocean?", but for now let's just look at the data. New Moons vs Full Moons From the figure above we can see that for Maui at least, full moons are just as influential, and in fact there are more full moons where the associated high tide is significantly higher than its new moon neighbor tides.   We do see a peak in tide heights in January, which is probably due to the Earth reaching its closest approach to the Sun on about January 3.   King Tides But the highest tides appear to be in summer, with the peak at full moon on August 1.  What causes this?  One would think that summer higher tides would be associated with the Sun being highest in the sky

Does the Moon Lift the Ocean to Create the Tides?

Image
We tend to think of the Moon's gravity "lifting" up the ocean underneath the moon in order to create the tidal bulge.  This is not how it works.  The earth's gravity is far too strong, and the ocean is too heavy, to be "lifted" by the Moon, 240,000 miles away.  Do you feel lighter when the moon is overhead?  Probably not, since the Moon's vertical force has been calculated to be one ten millionth of the Earth's gravity at points directly underneath the Moon. At points directly under the moon, such as point Z in the figure below, the gravity vector caused by the moon is perpendicular to the Earth's surface and has zero effect on the tides.  However at points not directly underneath the Moon, the gravity vector towards the Moon has a horizontal component which produces a "tractive force."  This force operates horizontally along the surface of the sea, and the sea presents relatively little resistance.  The sea is pulled from both sides to

Tide Lagging and Priming

Image
 What is the relationship between transits of the moon and the timing of the associated high tides on Maui? Here is a plot for 2023: Shown above are the tide lags for both upper transits (blue) and lower transits (hollow red). Positive lags mean high tide trails the transit.  We might think of this as the "normal" result, since the ocean system shouldn't be expected to respond to the moon's movements instantaneously.  A negative lag means the transit actually occurred after the high tide.   Positive lags predominate, as you can see.  The typical lag range is about 4 hours, with the mean lag for the year being about 2 hours.   Here is a closer look: As you can see, lags tend to decrease around the times of full and new moons.  This is called "priming".  For an simple example of priming see the Professor Tony Phillips example in the Reference blog.  

Halifax, Long Island, San Francisco

Image
 Bedford Institute, Halifax, Nova Scotia, Canada: Long Island, NY: San Francisco:

References, Acknowledgements, Contact Info

 References The Ocean Isn't Being Lifted, PBS, 2015, Youtube Virginia Institute of Marine Science, Tide Analysis Hicks, "Understanding the Tides", 2006 Parker, "Tidal Analysis and Predictions", 2007 Schureman, "Manual of Harmonic Analysis and Prediction of Tides", 1958 Professor Tony Phillips, Stonybrook, "Priming and Lagging" OCE: Analysis of Oceanographic Data, Dan Kelley and Clark Richards The plots here were done in the R environment.  The harmonic analyses and astronomical calculations were made possible by the OCE package, authored by Dan Kelley and Clark Richards, oceanographers from Halifax, Canada.  Many thanks to Dan and Clark for their illuminating conversations and emails. Contact me at gmail, same subdomain as this blog.